


MSNBC stats from: Office of Federal Housing Enterprise Over
marys1000
16 years ago
Sort by:Oldest
Comments (4)
Related Stories

HISTORIC HOMESHamilton, the House!
In Upper Manhattan, explore the gracious home of Alexander Hamilton, the founding father turned Broadway star
Full Story
HOME TECHThe Inevitable Future of Drones Around Your Home
As Google joins the push for airborne deliveries, it seems only a matter of time before neighborhoods are buzzing with drones. Is that OK?
Full Story
DECORATING GUIDESCalifornia Law: License to Practice Interior Design?
A proposed bill that would require a license to practice interior design in California has Houzzers talking. Where do you stand?
Full Story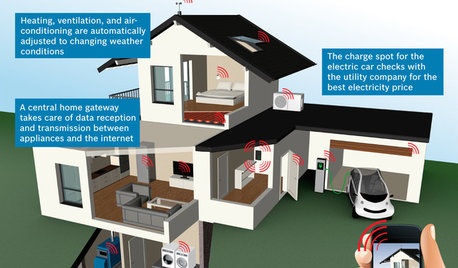
THE HARDWORKING HOMECES 2015: Inching Toward a Smarter Home
Companies are betting big on connected devices in 2015. Here’s a look at what’s to come
Full Story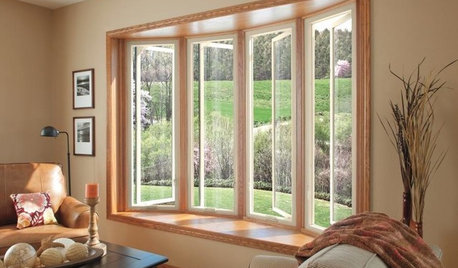
GREAT HOME PROJECTSUpgrade Your Windows for Beauty, Comfort and Big Energy Savings
Bid drafts or stuffiness farewell and say hello to lower utility bills with new, energy-efficient windows
Full Story
HOUSEKEEPINGHow to Clean Your Fridge, Inside and Out
Keep your refrigerator clean and fresh, while you gain storage space and lose those ‘UFOs’
Full Story


azdreamhome
azdreamhome
Related Discussions
After Wall Street Bailout, Is Main Street Headed for Depression?
Q
Need help please! Decisions on new Lennox heat pump system
Q
Fed Housing News Release- different data than Schiller
Q
Stats on Re-Finances?
Q
cindyb_va
kcfromnc