


historical minimum temperatures for RDU
CasaLester RTP, NC (7b)
10 years ago

Featured Answer
Sort by:Oldest
Comments (12)

Lynda Waldrep
10 years ago
dottie_in_charlotte
10 years agoRelated Discussions
Confusion about what zone I'm in...
Comments (9)A couple of months ago there was a retired meteorologist on a Seattle radio talk program. His topic was that although many weather data gathering stations have been located in the same place for decades no one has checked for environmental changes in those locations. He pointed out issues as stations that were originally in open fields are now surrounded by buildings which raise the recorded temperatures. One station near us has the town's sewer plant next to it now which also raises the temperature. Some have industrial exhaust chimenies nearby. He's concerned that the readings aren't accurate and can't be used for historical comparisons. When the show host asked him if he thought that "global warming" in the US climate was due to these factors he said NO. He said that issues of climate change are so important and we can't make good decisions based on inaccruate information. Tom...See MoreSemidesert conifers 7 The Sagalassos Expedition Day 4
Comments (2)Thank you very much for taking us up into the mountains and valleys of Turkey. Never been there myself,but it looks well arid! I really hope that those silvery Cedrus libani selections will come into the nursery trade one day ,not only because of their superior hardiness (am I right here?), but also to do away with C. libani's reputation of being a dark & cumbersome tree,only fit for graveyards! The 'Skinny Minney' Cupressus sempervirens look great too ! Have you come across any that are naturally sterile or,at least,bear fewer er...gambulli??? They would be most welcome in regions where heavy snow can wreak havoc on the already heavely laden branches.Thanks again! T....See More2013-2014 Official Dixondale Onion Ordering Thread
Comments (32)Friends, You are very welcome! It was a pleasure! I, too, was impressed with the quantity in the bunches, and also with them being "just the right size". That's my interpretation of neither too big to adapt, or too small to thrive. You may recall I ordered 19 bunches last year, and by the time the onions arrived I was in a new job that doesn't allow time for gardening. Seedpapa planted them all. This year, he set the limit at 2 bunches, so I only ordered 5. The overstuffed bunches kept him busy last weekend. We are still eating onions from last year. The ones we stored so carefully in the basement started sprouting about 8 weeks ago, but the ones we never managed to get out of the garage are still good. Go figure!...See MoreNC ultimate low temps last years "polar vortex"?
Comments (3)Depends, of course, where in NC. I'm just south of Charlotte and it got to 8 degrees measured but much lower with wind chill. Best part here is the cold is not continuous. A few days in a row. I'm referring to the polar vortex events (we had 2). Generally, it's rather rare to be in the single digits here in 7B-8A planting zone. As worrisome as the extreme cold is the increase of triple digit heat waves. That really impacts vegetable production and ripening no matter how much rain water is available. Being on the less extreme weather side of the the App. Mountains and far enough from wide rivers and major highways makes for more temperate, calmer weather events....See Moretrianglejohn
10 years agoLynda Waldrep
10 years agothatcompostguy
10 years agowertach zone 7-B SC
10 years agolsst
10 years ago
CasaLester RTP, NC (7b)
10 years agotrianglejohn
10 years agoLynda Waldrep
10 years agojqpublic
10 years ago

Related Stories
GREEN BUILDINGInsulation Basics: Designing for Temperature Extremes in Any Season
Stay comfy during unpredictable weather — and prevent unexpected bills — by efficiently insulating and shading your home
Full Story
HOUZZ TOURSHouzz Tour: Modern Addition for a Historic Bungalow
A 1927 redbrick home in a downtown historic neighborhood of Phoenix gets a metal-clad modern addition
Full Story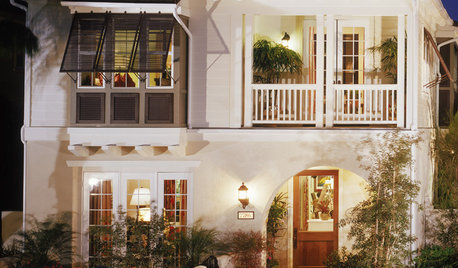
ARCHITECTURETime-Tested, Low-Tech Ways to Cool a Home
People have been beating the heat around the world for centuries without plugging anything in. Could these ideas work for your home today?
Full Story
FIREPLACESDesign Workshop: Is an Ethanol Fireplace Right for You?
Learn the pros, cons, types, cost and more details about ethanol, or gel-fueled, fireplaces
Full Story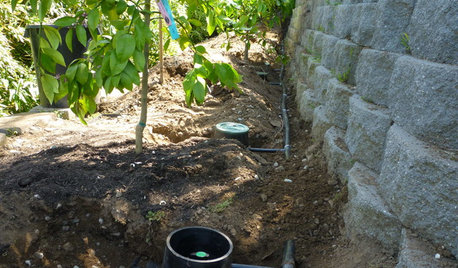
EARTH DAYGrow a Beautiful Garden With Ecofriendly Greywater
Reducing home water waste means lower bills and a healthier planet. Here's how to set up a greywater home irrigation system that can help
Full Story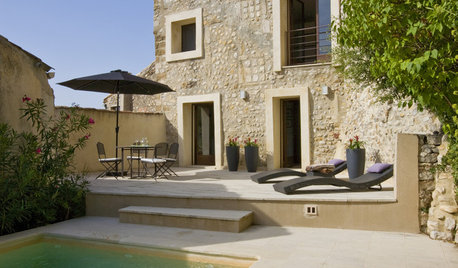
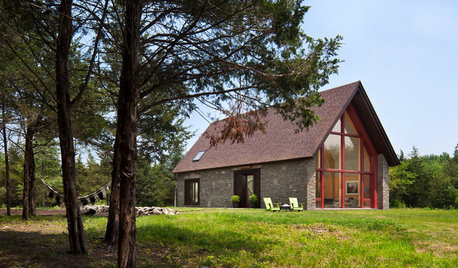
MODERN HOMESHouzz Tour: 800-Year-Old Walls, Modern Interiors in Provence
Old architecture and new additions mix beautifully in a luxurious renovated vacation home
Full Story
DECORATING GUIDESFinish Your Floors to Perfection With Parquet
Add value and gorgeous detail to your home with timeless and elegant parquet flooring in a classic design
Full Story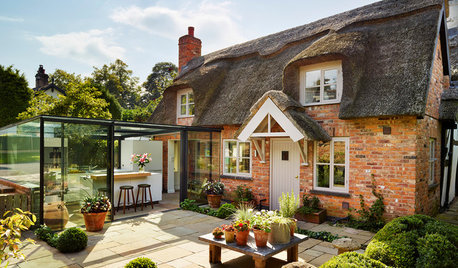
HOMES AROUND THE WORLDStorybook Cottage Gets an All-Glass Kitchen
A showstopping addition to a traditional thatched cottage houses a contemporary kitchen
Full Story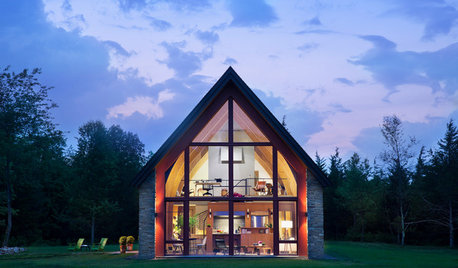
GREEN BUILDINGThe Passive House: What It Is and Why You Should Care
If you don’t understand passive design, you could be throwing money out the window
Full Story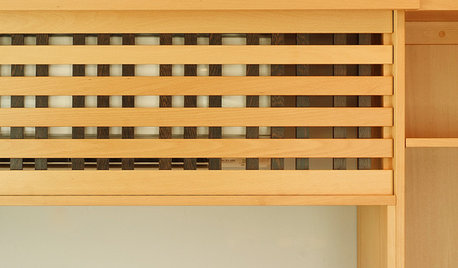
DECORATING GUIDES10 Ways to Hide That Air Conditioner
Feeling boxed in designing around your mini-split air conditioner? Try one of these clever disguises and distractions
Full Story
trianglejohn