
Search results for "Fertilizer" in Home Design Ideas
Refine by:
Budget
Sort by:Relevance
1 - 20 of 1,543 photos
Item 1 of 1

 Plan-it Earth Design
A rain garden on the property line is shared by both neighbors and provides a beautiful solution to a common problem
Design by Amy Whitworth
Installation and Stonework by Stormwater Resource Group

 Steve Masley Consulting and Design
Teenage eggplants hanging out. Eggplants thrive in containers, whether they're terra-cotta pots, or fabric Smart Pots. Photo by Steve Masley
Photo of a traditional landscaping in San Francisco.
Photo of a traditional landscaping in San Francisco.

 Olander Garden Design
Inspiration for a traditional shade backyard landscaping in Seattle.
Inspiration for a traditional shade backyard landscaping in Seattle.

 User
Photo: Ten Ten Creative
Wet bar - transitional single-wall dark wood floor and brown floor wet bar idea in Dallas with shaker cabinets, black cabinets, black backsplash, subway tile backsplash and gray countertops
Wet bar - transitional single-wall dark wood floor and brown floor wet bar idea in Dallas with shaker cabinets, black cabinets, black backsplash, subway tile backsplash and gray countertops
 User
This is an organic Lime Wash done with a true lime wash product as opposed to a brick mortar or concrete that is often seen on new houses. This product can be applied as a solid coating making the surface completely white, or can be applied and "washed off" in many artistic ways, as seen here. If you hate your brick or just want something unique this is a great option!
Photo credit: Jeff Murrey
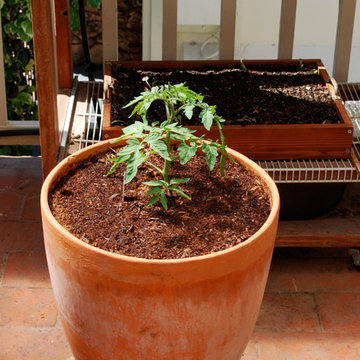 Steve Masley Consulting and Design
'Carmello' tomato growing in a 15-gallon terra-cotta pot, week 1. Photo by Steve Masley
Example of an eclectic home design design in San Francisco
Example of an eclectic home design design in San Francisco


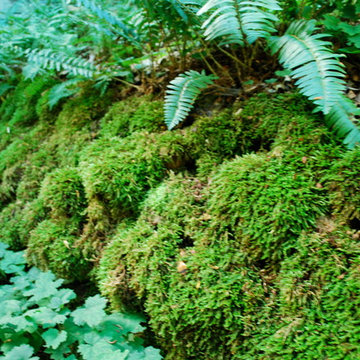
 Jay Sifford
Photo taken in the garden of David Benner. Photo by Jay Sifford
This is an example of a traditional landscaping in Charlotte.
This is an example of a traditional landscaping in Charlotte.

 Botanical Visions
This is an example of a mid-sized tropical full sun backyard stone landscaping in Miami for summer.

 Ky-Kan Coatings
Concrete can be made to look like any substance. Tile, stone, wood, brick, etc. With unlimited color options, Ky-Kan Coatings can transform any room in your home or business using lightweight, beautiful concrete.

 Krugel Cobbles, Inc.
Design by Kettelkamp & Kettelkamp Landscape Architecture; All Photos by Linda Oyama Bryan
Design ideas for a large traditional backyard gravel landscaping in Chicago.
Design ideas for a large traditional backyard gravel landscaping in Chicago.
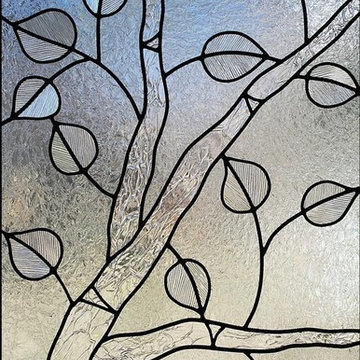
 contact7524
This stained glass window was created as part of our signature Aspen Stained Glass line. These windows look beautiful in cottage style or contemporary homes and are a great way for outdoor enthusiasts to celebrate their love of nature. The textured appearance of the glass provides the homeowners with a high level of privacy and comfort.

 Tri County Landscape
This landscape is filled with tropical plants, bushes, flowers, and palms. The full landscape adds shade to the walkways and still allows the "full sun" plants to flourish. The garden beds have unique specimens placed throughout which add character to the landscape.
 safe ZOnea
If you’re active on GardenWeb sharing plant photos, asking for advice, tracking seasonal progress you already understand how much detail goes into gardening. Soil pH, rainfall, emerging leaves, bloom counts, fertilizer schedules it adds up fast. But all that rich information often remains buried in posts, lists or memory. What if you could visualize that data and turn it into clear quick insights? That’s where a graph maker becomes a game-changer for your gardening workflow.
1. Why garden data belongs on a graph
On GardenWeb, you’ll find forums for everything from perennial care, vegetable gardening, patios, herbs, even cooking and craft projects. While plant lovers share observations and ask questions, many track progress manually in spreadsheets or memory. A graph maker flips that around:
Instead of a list of numbers (e.g., “Soil test: pH 6.4 in May, 6.1 in October”), you get a line graph showing the decline over time.
Instead of guessing which plant bloomed most, you see a bar chart comparing counts across plants.
Instead of manually calculating average rainfall effect, you plot scatter points of bloom count vs. rainfall.
By turning your data into visuals, you’re not just recording—you’re analysing, learning and improving. For GardenWeb users this means smarter decisions: Which fertilizer actually improves bloom count? Which shady spot recovers slower? A graph maker gives clarity.
2. What is a graph maker and how to use one
A graph maker is a web tool or software that lets you input raw data (numbers, dates, categories) and output visual charts like line graphs, bar charts, scatter plots, etc. It might allow you to import a spreadsheet, select chart type, customize colours, label axes, and export the image for your blog, forum post or personal log.
Here’s how you could apply it for gardening:
Log blooms per week for each rose plant.
Using the graph maker, choose line graph to track changes over weeks.
Label your y-axis “Number of Blooms”, x-axis “Week of Year”.
Add colour lines for each plant for easy comparison.
Export as PNG and embed it in a GardenWeb forum post: “See bloom trend for my ‘Peace’ vs ‘Knock Out’ roses”.
This isn’t just pretty-to-look-at: it makes the trend obvious, invites discussion (“Hey, your ‘Knock Out’ line dips after week 28—what changed?”) and helps you refine your routine.
3. Use these specific scenarios on GardenWeb
A. Soil pH and plant health tracking
After multiple tests you have pH values over time and bloom results. Upload both datasets into the graph maker, produce a dual-axis line graph: soil pH on one axis, bloom count on the other. Post your findings in the “Soil, Fertility & Nutrients” forum and get feedback.
B. Seasonal pest or disease appearance
Record number of aphids spotted each month and whether you used treatment. A bar chart via the graph maker can show pre- and post-treatment figures. Then ask the “Insect & Disease Control” forum for advice based on your visual data.
C. Yield comparison between varieties
You grow two zucchini varieties. You keep weekly yield in pounds. Use the graph maker for a side-by-side bar chart. Share in the “Vegetable Gardening” forum: “Which was better this year? See the chart”.
D. Rainfall vs growth rate
You log weekly rainfall and growth (in cm) of your tomato plants. Use scatter plot in graph maker. If a pattern emerges, you’re ready to post: “Is my growth plateau due to drought? Chart shows a clear correlation.”
4. Why this elevates your GardenWeb contributions
When you post with a chart made by a graph maker, you’re doing more than asking or showing off. You’re investigating. You’re analysing. You invite the community to give feedback on data, not just anecdotes. That elevates the discussion. Instead of “My plant died, any ideas?” you post “See this graph of pH drop and bloom count—what might be the limiting factor?” High-quality visuals raise your post’s value and garner more thoughtful responses.
Plus, your posts become useful references for others: someone else can say, “Cool graphic, can you share your data sheet?” You build credibility and help the forum become a learning hub—not just a Q&A board.
5. Tips for using a graph maker effectively in the GardenWeb context
Keep it simple: One chart, one insight. Don’t overcrowd.
Label clearly: Titles, axis labels, units (e.g., cm/week, mg/L, °F).
Use readable colours: Avoid faint tones that vanish on mobile.
Annotate when needed: Add notes like “Fertiliser switched week 12” or “Shade cloth added”.
Provide context in your post: Don’t leave the chart alone—write a few sentences explaining what it shows and what you’re seeking.
Embed carefully: Make sure your image displays properly in GardenWeb; check mobile view.
Share raw data: If possible link to your spreadsheet so others can replicate or comment.
Be open to feedback: The chart invites questions; embrace them.
6. Possible pitfalls and how to avoid them
Bad data = bad chart: If your measurements aren’t consistent, your graph will mislead. Use standardized data collection.
Too much complexity: Multi-axis charts, too many variables—confusing. Stick to one or two variables.
Overlooking mobile viewers: Many GardenWeb users browse via phones. Use large fonts and simple visuals.
Ignoring the narrative: Chart alone won’t answer. Explain what it means and what you need.
Outdated charts: If you update your data annually, keep your visuals current or label them clearly as “2024 data”.
7. Final thoughts
On GardenWeb you’ll find a vibrant community of gardeners, DIYers, cooks and design lovers.Using a graph maker for your posts and progress turns your experience from casual hobby-logging into smart data-driven gardening. You’ll not only learn more—your peers will learn more, too.
So next time you log your plant growth, record your yield, test your soil or track pests—don’t just note it. Plot it. Use a graph maker. Share it in the forum. Let your garden tell the story, and let the community help you write the next chapter.


 All Surface Restoration
Paver Gloss Sealer is a professional grade wet look exposed aggregate sealer that adds a rich, glossy appearance. It is a wet look/satin sheen acrylic sealer designed for use on all types of exterior concrete and pavers. Its pure acrylic formula allows for superior penetration and bonding. The durable finish left behind is UV stable and will not yellow. It offers superior resistance to rain, the sun, cold and hot climates, stains, and more. When applied to dull or faded exposed aggregate it will help to enhance the original coloring.
Applications: Exposed aggregate driveways, sidewalks and walkways, patios and pool decks and more.
It contains 20% acrylic solids & creates a lasting wet look. Esthetically pleasing, it beautifies and enriches the colors of the aggregate stones while protecting concrete. It forms a protective film, preventing the penetration of oil, water dirt & stains from the environment. This solvent base clear acrylic sealer penetrates to creating a lasting finish that will resist the assaults of elements such as the freeze-thaw cycles, sun, rain, and snow. It’s a great choice for high traffic area’s, which require maximum protection.
Paver Gloss Sealer can be purchased in 5 Gallon pails shipped via UPS ground to all 48 U.S. States EXCEPT Alaska & Hawaii at http://surfacerestoration.com/shop

 Diamond Cut Garage Floors - Garage Floor Coatings
Example of a large classic attached three-car garage design in Dallas
 Houtje Touwtje
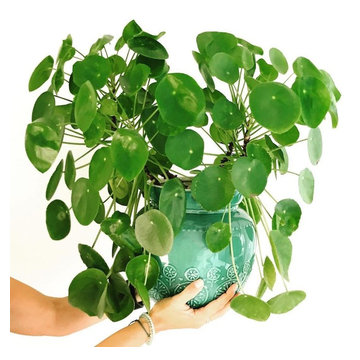
We moved these four Pileas to a bigger pot when they were still young, about three years ago. The bigger the pot, the more space they have to grow and the bigger the plant will become. Credits: instagram.com/houtje.touwtje
1