Some USDA zones for various Northwest locations
ian_wa
13 years ago
Related Stories

REMODELING GUIDESHouzz Tour: A Fresh Pacific Northwest Take on Midcentury Modern
This updated ’60s modern vacation home honors the past while embracing its sublime surroundings
Full Story
HOUZZ TOURSMy Houzz: A Northwest Home Honors Its Midcentury Roots
A couple embrace Scandinavian modern to preserve the integrity of their home, built by midcentury architect Kenneth Brooks
Full Story
HOUZZ TOURSMy Houzz: Whimsy and Art in a Northwest Home
Striking, memorable pieces help spark creativity for a designer-artist couple in Spokane
Full Story
GARDENING AND LANDSCAPINGGarden Lessons from a Grand Northwest Reserve
Borrow classic landscape ideas from this Washington state treasure, a series of gardens as thoughtfully planned as they are spacious
Full Story
HOUZZ TOURSMy Houzz: Classic Northwest Charm
A couple's decade-long renovation includes a simple color palette, custom-built features and a few secret messages
Full Story
CONTEMPORARY HOMESHouzz Tour: Coastal New England Style Meets Pacific Northwest Modern
Homeowners ease into retirement in this Camano Island home, enjoying seaside views, cooking and gardening
Full Story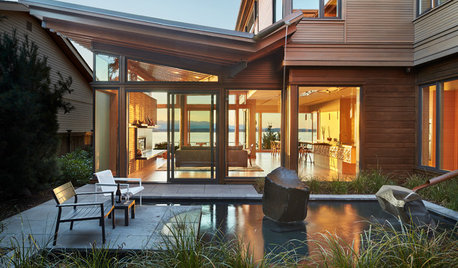
MODERN ARCHITECTUREHouzz Tour: Pacific Northwest Landscape Inspires a Seattle Home
Sweeping views, an intimate courtyard and local materials create an inviting atmosphere
Full Story
KITCHEN WORKBOOKNew Ways to Plan Your Kitchen’s Work Zones
The classic work triangle of range, fridge and sink is the best layout for kitchens, right? Not necessarily
Full Story
COLORTime to Step Out of Your Color Comfort Zone?
If you always seem to pick warm tones, or you stick to the cool ones, bucking your natural inclination could bring new energy to a room
Full Story
MOST POPULARKitchen Evolution: Work Zones Replace the Triangle
Want maximum efficiency in your kitchen? Consider forgoing the old-fashioned triangle in favor of task-specific zones
Full Story


George Three LLC
grrrnthumb
Related Discussions
2012 USDA Plant Hardiness Zone Map
Q
Draft 2003 USDA Hardiness Map - new Tropical Zones
Q
New 2012 USDA zones!
Q
Anyone else growing Tsuga canadensis in usda zone 3?
Q
larry_gene
Embothrium
kristincarol
Embothrium
ian_waOriginal Author
grrrnthumb
ian_waOriginal Author
Embothrium
larry_gene
dave_olympia
Embothrium
ian_waOriginal Author
Embothrium
ian_waOriginal Author
Embothrium