

USB Thermometers - A quick review
m_lorne
14 years ago
Sort by:Oldest
Comments (3)
Related Stories
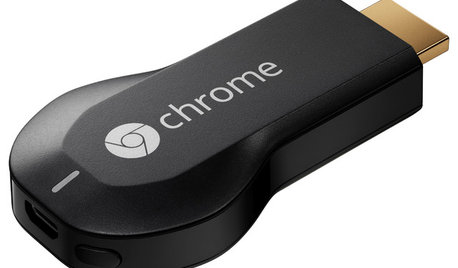
HOME TECHNow Playing in Homes Everywhere: TV, the App
It's easier than ever to beam streaming content from mobile devices to your TV screen
Full Story
HOME TECHHarness the Cloud: 8 Ways to Automate Your Housekeeping
Make life easier by scheduling regular deliveries, managing appliances, simplifying meal planning and more via the web
Full Story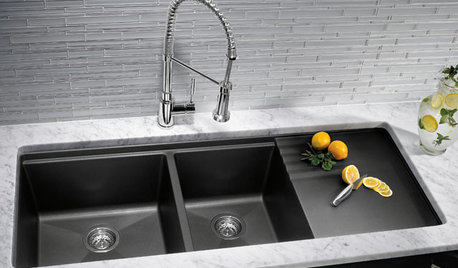
KITCHEN DESIGNKitchen Sinks: Granite Composite Offers Superior Durability
It beats out quartz composite for strength and scratch resistance. Could this kitchen sink material be right for you?
Full Story
MOST POPULARHow Bluetooth 4.0 Will Change Remote Control
Manage lights, TV, refrigerators and more through your phone or tablet when the latest wireless technology rolls into all your home devices
Full Story
40 Stylish Gifts for Modern Men
Houzz Gift Guide 2010: What to Buy for the Guy Who Has (Almost) Everything
Full Story
MOST POPULAR10 Strategies for Keeping Surfaces Clutter-Free
The universe wants your coffee table to become a clutter magnet — but you can fight back
Full Story
LIFEHow to Prepare for and Live With a Power Outage
When electricity loss puts food, water and heat in jeopardy, don't be in the dark about how to stay as safe and comfortable as possible
Full Story
COLORWant Gorgeous Interior Colors? Look to the Light
See how to manipulate natural and artificial light — and learn about those baffling new bulbs — to get the exact room colors you want
Full Story
CONTRACTOR TIPSBuilding Permits: 10 Critical Code Requirements for Every Project
In Part 3 of our series examining the building permit process, we highlight 10 code requirements you should never ignore
Full Story
HOME TECH7 Ways to Charge Up and Connect After Disaster
Products and tips for communicating and keeping essential items running till the power's back on
Full Story
jimster
cyrus_gardner
Related Discussions
Digital thermometer reommendation please
Q
Anyone have this USB Heating Blanket?
Q
Thermometer recommendation for yogurt making?
Q
New construction - anyone suggest electrical outlets with USB?
Q
zeuspaul