


Industry Research
Renovation Barometer
Home Remodeling Is Back to Pre-Pandemic Levels
Homeowners are contacting pros and embarking on projects to improve their homes, Houzz research shows

If you’ve been spending more time in your home and yard this year and considering ways to improve them, you’re not alone. Homeowners tackling projects are helping the residential remodeling industry prosper amid a challenging year. In fact, business is booming and back to pre-pandemic levels for design and construction firms, new data from Houzz shows.
“The results from the Houzz Q4 Barometer show that the home remodeling and design industry is truly resilient, and is seeing business activity return to pre-pandemic levels,” says Marine Sargsyan, Houzz senior economist.
“The results from the Houzz Q4 Barometer show that the home remodeling and design industry is truly resilient, and is seeing business activity return to pre-pandemic levels,” says Marine Sargsyan, Houzz senior economist.
A score higher than 50 indicates that more firms reported increases than decreases in their recent business activity.
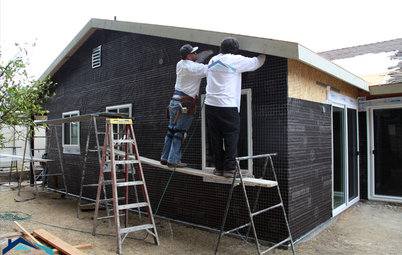
Construction Firms
1. Recent business activity increased significantly. Despite the pandemic, residential remodeling activity has been strong over the past three months for firms on the construction side of the business. An increase in both new project inquiries and new committed projects in July, August and September lifted the Recent Business Activity Indicator of the Barometer to 75, a level construction firms have not seen in nearly two years. This score was up 26 points from the previous quarter.
The Recent Business Activity Indicator of the Barometer looks at actual activity over the previous three months. It’s based on survey questions that ask businesses to report whether they observed the actual number of project inquiries and new committed projects increasing, decreasing or staying the same in the previous three months relative to the three months before that.
2. Project wait times rose nationally. Given all this recent demand, it may not be surprising to learn that if you’re considering a home remodel, you might face a wait to get started. Construction businesses that are focused on remodeling reported that wait times before they can take on a midsize project from a new client now average 7.2 weeks, up 1 week compared with the start of the previous quarter.
One year ago, the national average wait time was 5.2 weeks, meaning the average wait time has risen by 2 weeks year over year.
Among construction firms, build-only remodelers have the longest average wait time before they can take on a midsize project: 7.3 weeks, up 1.9 weeks from the start of the prior quarter. Wait times for design-build remodelers average 7.1 weeks, up 0.1 week compared with the start of the previous quarter.
In contrast with the Recent Business Activity Indicator, which looks back in time, the Project Backlog Indicator looks forward to the wait times firms forecast for the next three months.
Wait times (or backlogs) range widely by region, as this map shows. The East South Central division of the U.S. (Alabama, Kentucky, Mississippi, Tennessee) has the shortest average wait time (4.7 weeks), while the New England division (Connecticut, Maine, Massachusetts, New Hampshire, Rhode Island, Vermont) has the longest (10.5 weeks) among the nine geographic divisions as defined by the U.S. Census.
A score higher than 50 indicates that more firms reported increases than decreases in their business expectations. Q2 2020 marked the first time since the Houzz Barometer began in 2015 that scores fell below 50.
3. Expectations for business activity decreased slightly. Build-only remodelers and design-build remodelers reported strong expectations for business activity going into the fourth quarter of 2020. This sentiment is captured by the Expected Business Activity Indicator of the Barometer level of 73 for Q4.
The Expected Business Activity Indicator is based on survey questions that asked businesses to report whether they expected the number of project inquiries and new projects to increase, decrease or be unchanged in the coming three months compared with the prior three months. A score higher than 50 indicates that more firms expected increases than decreases.
While the Q4 score is down from 75 at the start of the third quarter, it is significantly up from the all-time low of 18 seen at the start of the second quarter this year, in the early days of the pandemic. It’s also about in line (just 1 point down) with expectations at the start of this year, as well as with expectations a year ago.
Architectural and Design Services Firms
1. Recent business activity rose. Similar to construction firms, architecture and design services firms welcomed a rise in recent project inquiries and new committed projects in July, August and September that lifted the score for the Recent Business Activity Indicator of the Barometer to 61, up 13 points from the prior three months. Relative to the same period a year ago, this indicator is up 4 points.
1. Recent business activity rose. Similar to construction firms, architecture and design services firms welcomed a rise in recent project inquiries and new committed projects in July, August and September that lifted the score for the Recent Business Activity Indicator of the Barometer to 61, up 13 points from the prior three months. Relative to the same period a year ago, this indicator is up 4 points.
2. Wait times held steady nationally. Wait times for architectural and design firms average 4.5 weeks nationally at the start of the fourth quarter of 2020, flat with the start of Q3 2020.
Compared with a year ago, when wait times were 4.1 weeks, wait times are up 0.4 week.
Taking a closer look by professional type, interior designers have longer wait times to take on a new midsize project (4.8 weeks, up 2 weeks relative to the start of the previous three months) than do architects (4.3 weeks, down 1.2 weeks relative to the start of the previous three months).
Again, wait times (or backlogs) vary significantly by region, as this map shows. The West North Central division of the U.S. (Iowa, Kansas, Minnesota, Missouri, Nebraska, North Dakota, South Dakota) has the shortest average wait time (3.4 weeks), while the East North Central division (Illinois, Indiana, Michigan, Ohio, Wisconsin) and Pacific division (California, Oregon, Washington) have the longest (5 weeks).
3. Business activity expectations decreased somewhat. Architects and interior designers reported moderately lowered expectations for new business activity for the fourth quarter of 2020 compared with the start of the previous quarter. Their score of 62 for the Expected Business Activity Indicator shows that more firms are expecting increases in new business activity than are expecting decreases. This measure is down 5 points from the start of Q3 2020, when it was 67.
This score is also down 5 points compared with the same period a year ago.
Architects reported a 7-point decrease in overall expectations, to 57, relative to the start of Q3 2020. Interior designers’ expectations decreased by 3 points, to 70, relative to the start of the third quarter.
This score is also down 5 points compared with the same period a year ago.
Architects reported a 7-point decrease in overall expectations, to 57, relative to the start of Q3 2020. Interior designers’ expectations decreased by 3 points, to 70, relative to the start of the third quarter.
The Houzz Renovation Barometer is based on a quarterly online survey sent to a national panel of U.S. businesses with profiles on Houzz. The Barometer includes three components: Expected Business Activity, Recent Business Activity and Project Backlog (or wait times). Expectations and business activity data are smoothed out to allow for predictable seasonal fluctuations, while wait-time data are not.
If you’re a pro and would like to offer your insights on market conditions in your area by joining the Barometer panel, please click here.
Read more on this and past Barometer reports
Tell us: Whether you’re a pro or a homeowner, we’d love to hear how this report compares with your experiences. Please share in the Comments.
More on Houzz
Read more stories about remodeling trends
Browse millions of photos for inspiration
Find a pro to help with your project
Shop for products


“Home professionals have a positive outlook through the end of the year, despite unprecedented uncertainty due to the pandemic and the upcoming election, increasing supply chain constraints as well as shortages in the labor market,” Sargsyan says. “Pros are taking on new clients remotely using online tools and collaboration platforms.”
If you’re in the midst of a home design or renovation project, you may have noticed that many pros can now collaborate with you remotely and move your project forward with social distancing in place. Architecture and design firms have responded to pandemic-related business challenges by offering video consultations (56%), implementing safety guidelines at the office and project site (49%), providing remote collaboration tools (48%) and sourcing more products online (46%). Construction businesses have implemented new safety guidelines (60%), used video consultation tools (33%) and sourced more products online (31%).
Now, 85% of firms in the architectural and design services sector and 87% of firms in the construction sector have a neutral to very good outlook for the rest of 2020, despite what has been a chaotic year on a national level. Read on for more details on how business conditions might affect you if you’re looking to start a project. We’ll first look at construction companies and then at firms in the architectural and design services areas.
The Benefits of Working With a Houzz Pro